Ilia M.
Linux Server Administrator &
DevOps
Designing and maintaining reliable Linux infrastructure with observability, automation and security
## ABOUT
Hands-on experience designing and operating Linux-based infrastructure.
Built a full monitoring stack with Prometheus and Grafana, deployed containerized services with Docker,
and implemented secure reverse proxy architecture with Nginx.
Focused on reliability, observability and automation rather than just deployment.
## INFRASTRUCTURE
VPS Infrastructure
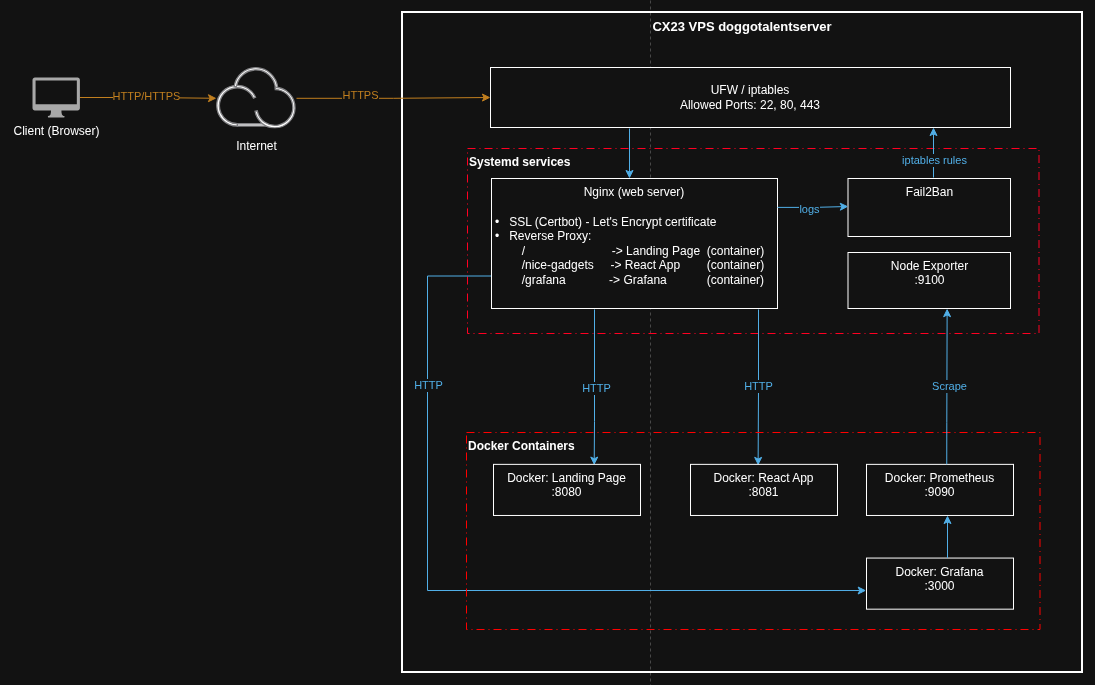
Ubuntu 24.04.4 LTS server with hardened security configuration (UFW, Fail2Ban). Managed via SSH with key-based authentication.
Nginx Reverse Proxy
SSL/TLS termination with Let's Encrypt certificates. Routes traffic to Docker containers based on domain/subdomain configuration.
Containerized Services
Docker Compose orchestration for Grafana (visualization), Prometheus (metrics collection), and web applications. Internal Docker network for service communication.
Monitoring & Observability
Prometheus scrapes metrics from Node Exporter and application endpoints. Grafana dashboards provide real-time system and application monitoring.
## PROJECTS
VPS Infrastructure & Monitoring Stack
Complete infrastructure deployment with containerized monitoring solution. Reduced attack surface with firewall rules and Fail2Ban, implemented automated encrypted backups to ensure data safety
eCommerce Web App Deployment
Deployed React-based eCommerce application with Nginx reverse proxy. Integrated Supabase backend and resolved complex networking issues.
Automated Backup & Recovery System
Implemented automated backup solution using cron jobs and systemd timers. Configured off-site backup storage with encryption.
## LIVE MONITORING
Real-Time Server Monitoring
Production infrastructure is continuously monitored using Prometheus and Grafana. Metrics include CPU usage, memory consumption, disk I/O and network traffic.
Last updated: 2s ago
## SKILLS
Infrastructure
- • Linux (Ubuntu, Debian)
- • systemd & service management
- • cron & scheduled tasks
- • Shell scripting (Bash)
- • SSH & remote administration
Containers & Orchestration
- • Docker & Docker Compose
- • Container networking
- • Volume management
- • Image optimization
- • Multi-container applications
Networking
- • DNS configuration
- • TCP/IP fundamentals
- • Nginx reverse proxy
- • SSL/TLS certificates
- • VPN setup & configuration
Monitoring & Observability
- • Prometheus metrics collection
- • Grafana dashboards
- • Node Exporter
- • Alert configuration
- • Log analysis
Security
- • UFW firewall configuration
- • Fail2Ban intrusion prevention
- • SSH hardening
- • Security auditing
- • Key-based authentication
## CONTACT
SysAdmin • SRE • DevOps — Open for work.